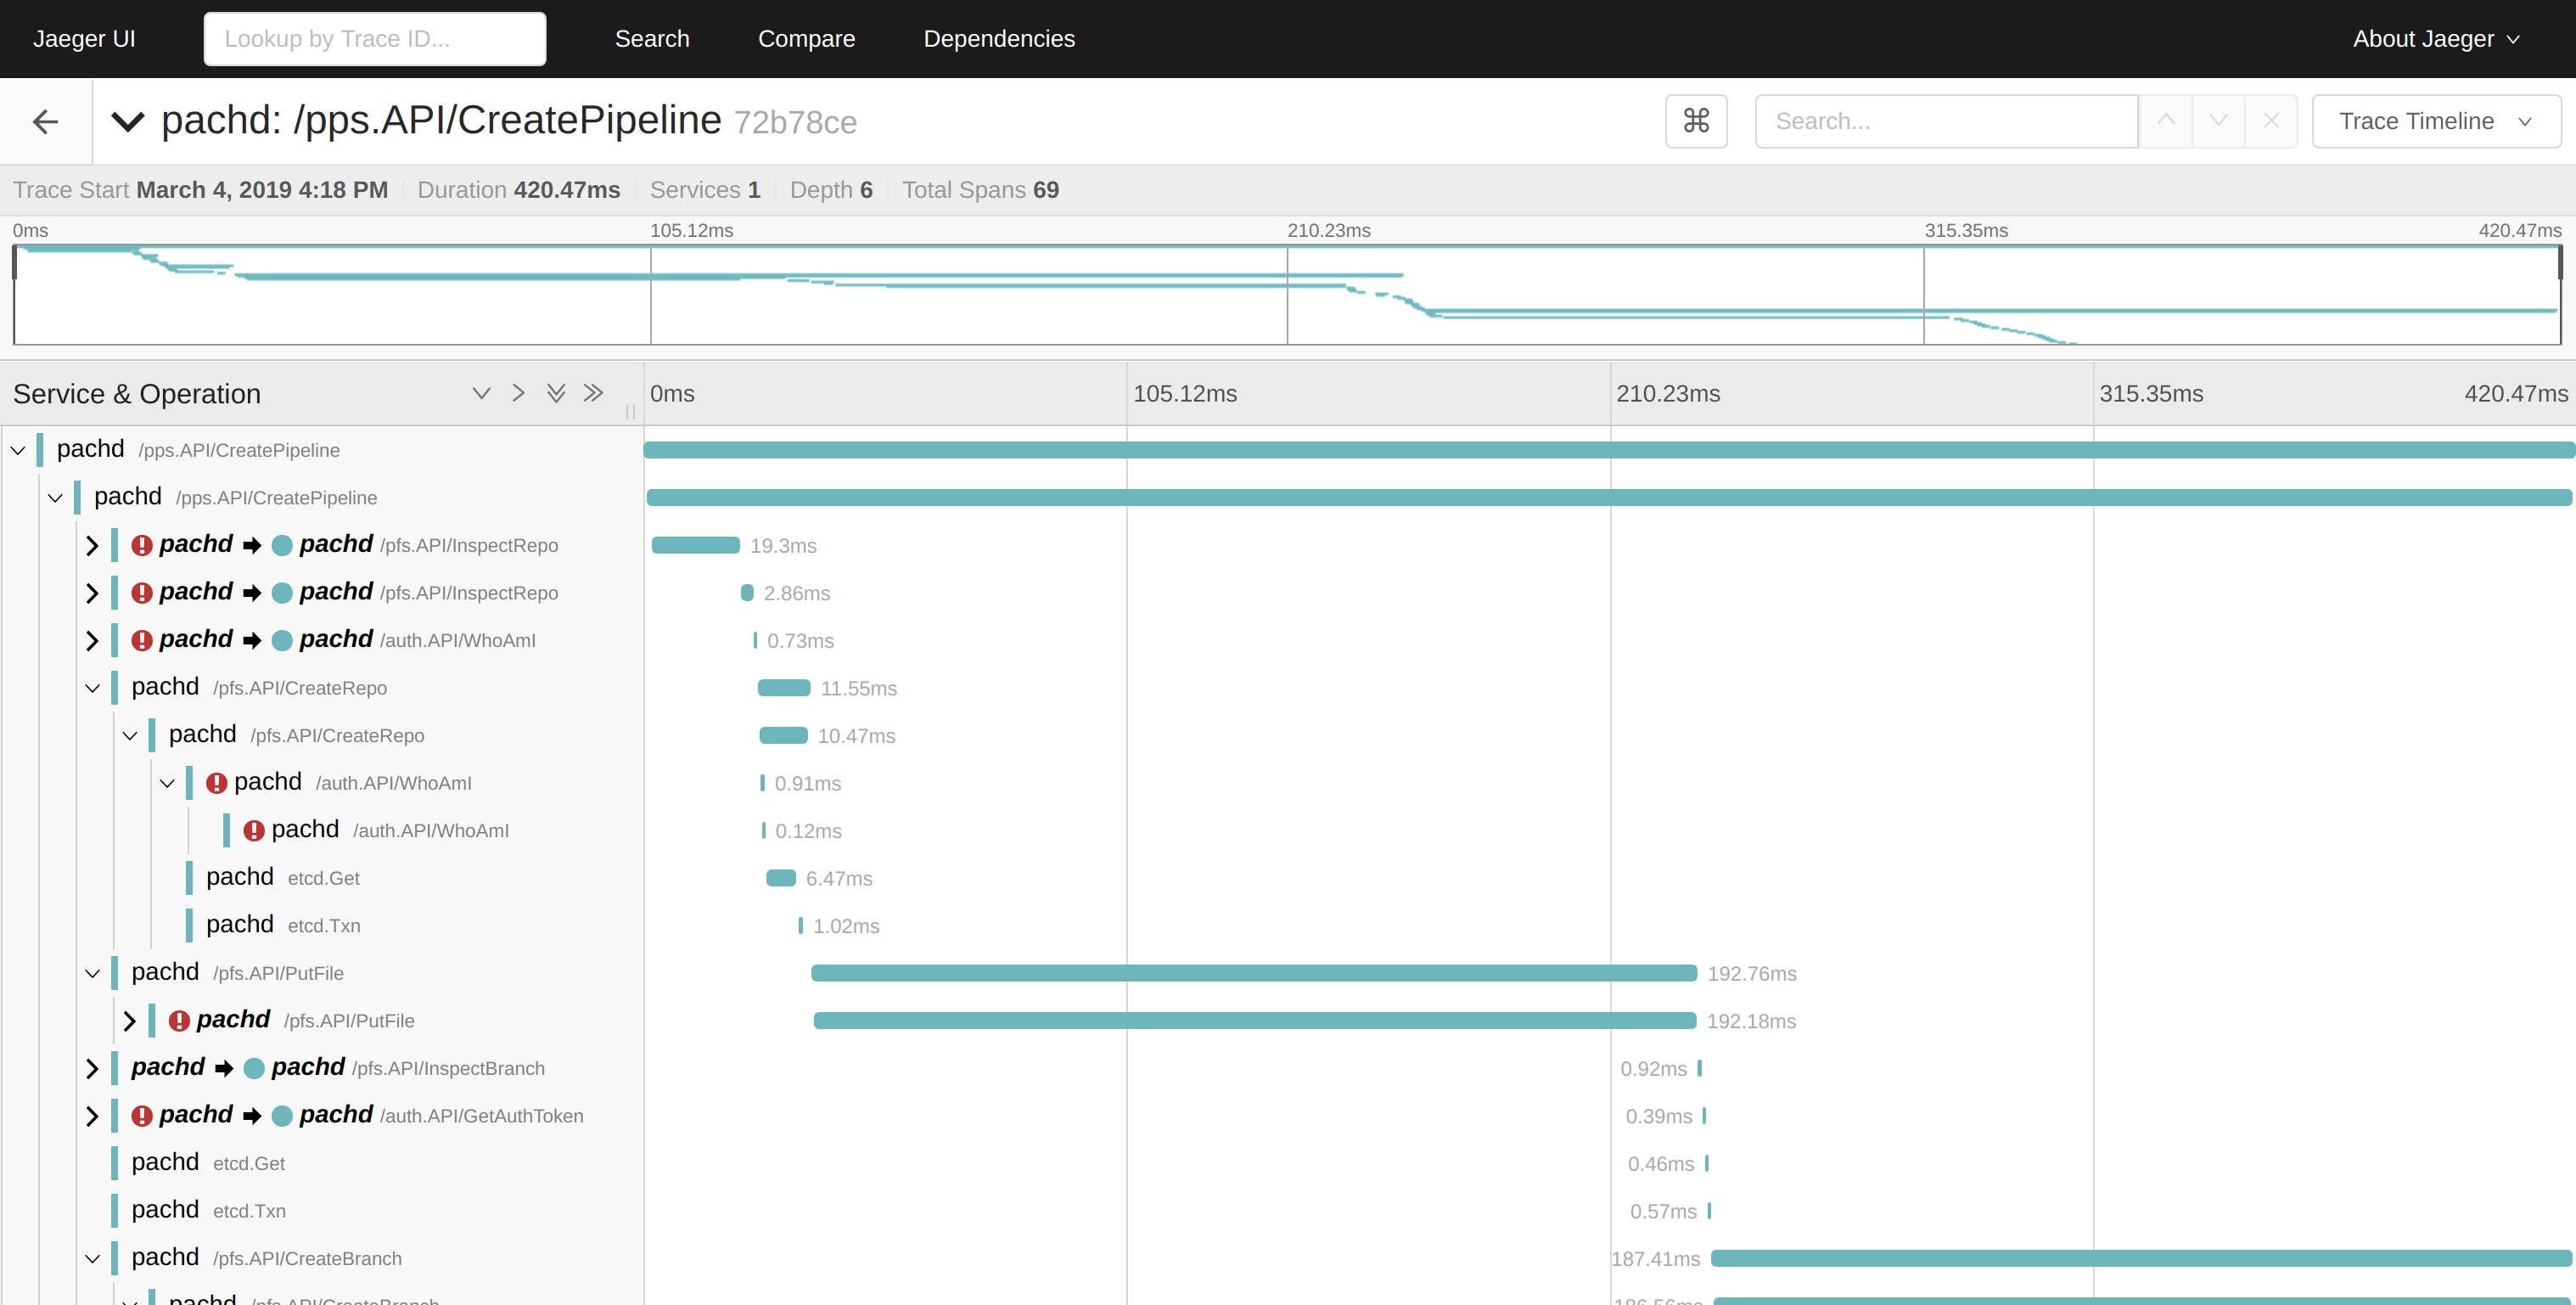
Pachyderm has the ability to trace requests using Jaeger. This can be useful when diagnosing slow clusters.

Collecting Traces #
To use tracing in Pachyderm, complete the following steps:
Run Jaeger in Kubernetes
kubectl apply -f https://raw.githubusercontent.com/pachyderm/pachyderm/v2.7.4/etc/deploy/tracing/jaeger-all-in-one.yamlPoint Pachyderm at Jaeger
For
pachctl, run:export JAEGER_ENDPOINT=localhost:14268 kubectl port-forward svc/jaeger-collector 14268 & # Collector serviceFor
pachd, run:kubectl delete po -l suite=pachyderm,app=pachdThe port-forward command is necessary because
pachctlsends traces to Jaeger (it actually initiates every trace), and reads theJAEGER_ENDPOINTenvironment variable for the address to which it will send the trace info.Restarting the
pachdpod is necessary becausepachdalso sends trace information to Jaeger, but it reads the environment variables corresponding to the Jaeger service[1] on startup to find Jaeger (the Jaeger service is created by thejaeger-all-in-one.yamlmanifest). Killing the pods restarts them, which causes them to connect to Jaeger.
Send Pachyderm a traced request by setting the
PACH_TRACEenvironment variable to “true” before running anypachctlcommand (note thatJAEGER_ENDPOINTmust also be set/exported):PACH_TRACE=true pachctl list job # for examplePachyderm does not recommend exporting
PACH_TRACEbecause tracing calls can slow them down and make interesting traces hard to find in Jaeger. Therefore, you might want to set this variable for the specific calls you want to trace.However, Pachyderm’s client library reads this variable and implements the relevant tracing, so any binary that uses Pachyderm’s go client library can trace calls if these variables are set.
View Traces #
To view traces, run:
kubectl port-forward svc/jaeger-query 16686:80 & # UI serviceThen, connect to localhost:16686 in your browser, and you should see all
collected traces.
See Also: Kubernetes Service Environment Variables
Troubleshooting #
If you see
<trace-without-root-span>, this likely means thatpachdhas connected to Jaeger, butpachctlhas not. Make sure that theJAEGER_ENDPOINTenvironment variable is set on your local machine, and thatkubectl port-forward "po/${jaeger_pod}" 14268is running.If you see a trace appear in Jaeger with no subtraces, like so:

This might mean that
pachdhas not connected to Jaeger, butpachctlhas. Restart thepachdpods after creating the Jaeger service in Kubernetes.

