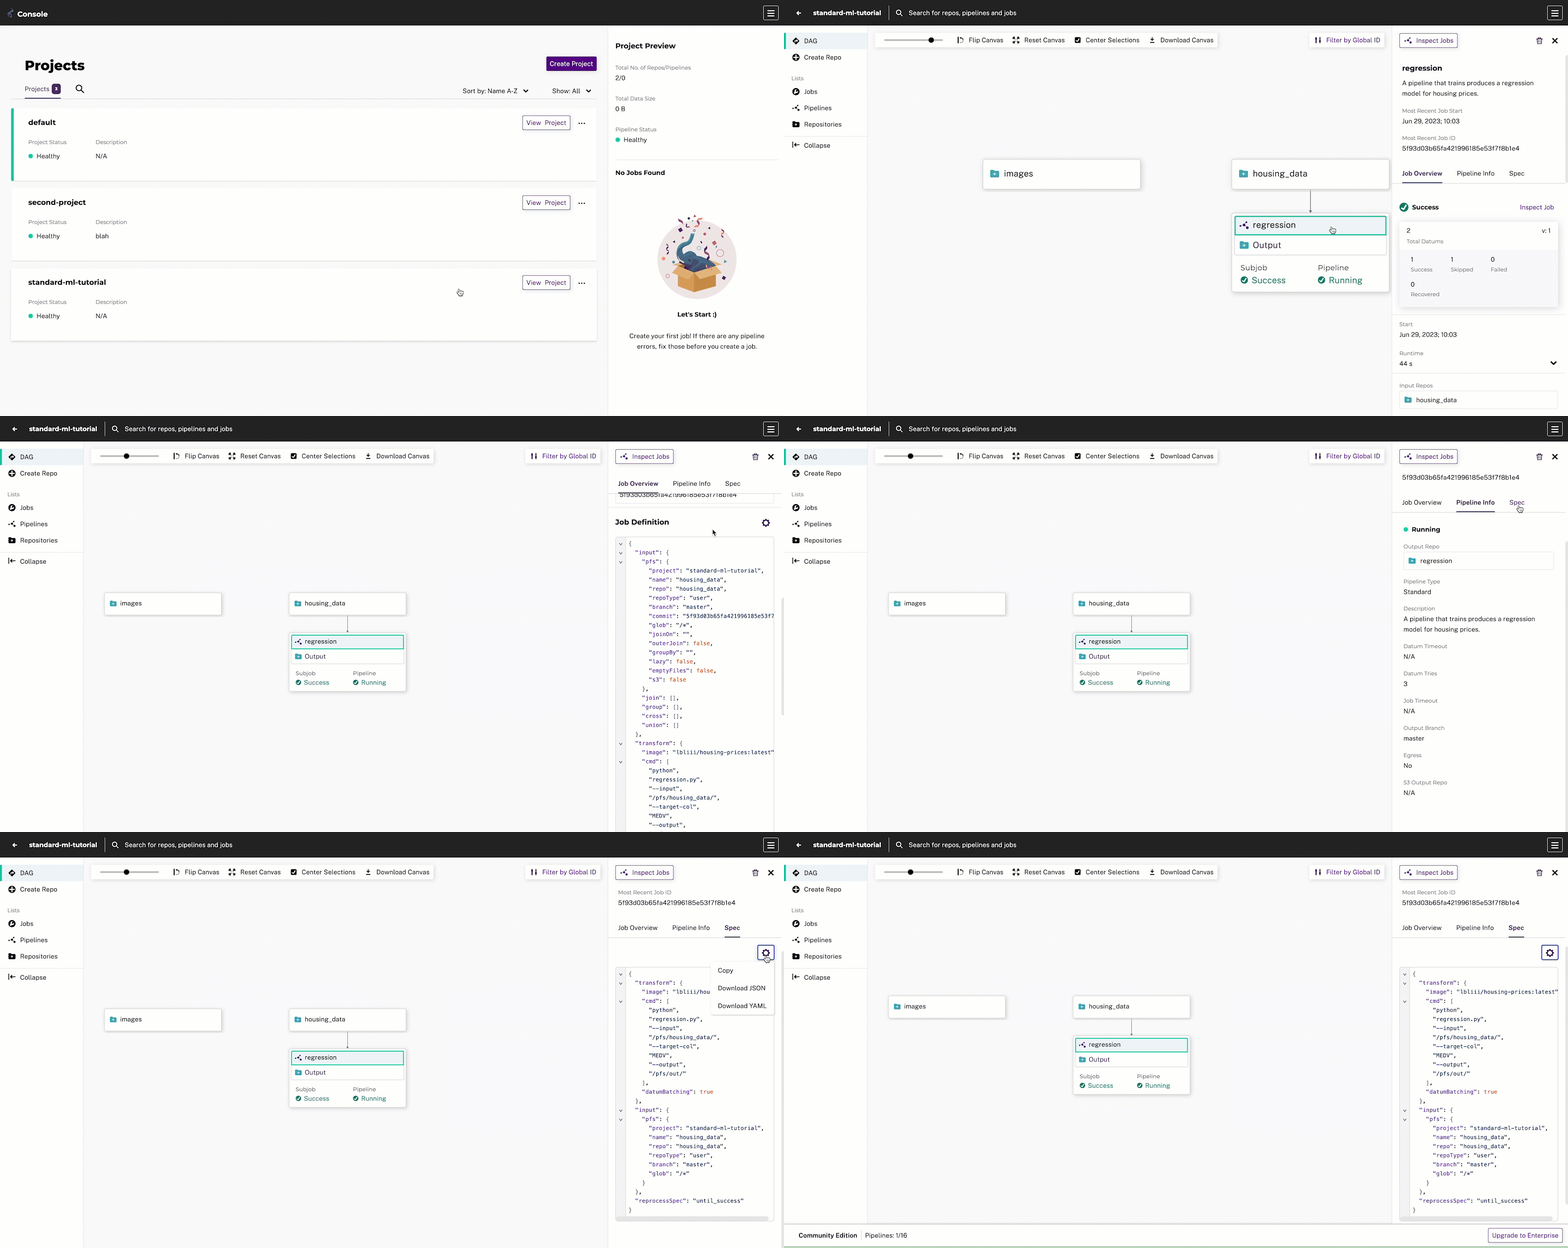
You can inspect a pipeline via PachCTL or the Console. When you inspect a pipeline, you can see key details such as its input configuration, output configuration, and transformation image/command details.
How to Inspect a Pipeline #
Tool:
pachctl inspect pipeline <pipeline-name>Example output:
Name: regression
Description: A pipeline that trains produces a regression model for housing prices.
Created: 4 weeks ago
State: running
Reason:
Workers Available: 1/1
Stopped: false
Parallelism Spec: <nil>


Datum Timeout: (duration: nil Duration)
Job Timeout: (duration: nil Duration)
Input:
{
  "pfs": {
    "project": "standard-ml-tutorial",
    "name": "housing_data",
    "repo": "housing_data",
    "repo_type": "user",
    "branch": "master",
    "glob": "/*"
  }
}

Output Branch: master
Transform:
{
  "image": "lbliii/housing-prices:latest",
  "cmd": [
    "python",
    "regression.py",
    "--input",
    "/pfs/housing_data/",
    "--target-col",
    "MEDV",
    "--output",
    "/pfs/out/"
  ],
  "datum_batching": true
}- Open the Console UI.
- Navigate to the project containing the pipeline.
- From the DAG view, select the pipeline name. A slideout panel appears with three tabs you can inspect: Job Overview, Pipeline Info, and Spec.


